This function computes for each age category the corresponding variance expression profile.
Usage
PlotVars(
  ExpressionSet,
  Groups = NULL,
  legendName = "age",
  xlab = "Ontogeny",
  ylab = "Variance(Expression Level)",
  main = "",
  y.ticks = 10,
  adjust.range = TRUE
)
Arguments
- ExpressionSet
a standard PhyloExpressionSet or DivergenceExpressionSet object.
- Groups
a list containing the age categories for which variance expression levels shall be drawn. For ex. evolutionary users can compare old phylostrata: PS1-3 (Class 1) and evolutionary young phylostrata: PS4-12 (Class 2). In this example, the list could be assigned as,
Groups = list(c(1:3), c(4:12)). The group options is limited to 2 Groups.- legendName
a character string specifying the legend title.
- xlab
label of x-axis.
- ylab
label of y-axis.
- main
main text.
- y.ticks
number of ticks that shall be drawn on the y-axis.
- adjust.range
logical indicating whether or not the y-axis scale shall be adjusted to the same range in case two groups are specified. Default is
adjust.range = TRUE.
Details
This plot may be useful to compare the absolute variance expression levels of each age category across stages.
In different developmental processes different phylostratum or divergence-stratum
classes might be more expressed than others, hence contributing more to the overall
phylotranscriptomics pattern (TAI or TDI).
This plot can help to identify the phylostratum or divergence-stratum classes
that contributes most to the overall transcriptome of the given developmental process.
Examples
### Example using a PhyloExpressionSet
### and DivergenceExpressionSet
# load PhyloExpressionSet
data(PhyloExpressionSetExample)
# load PhyloExpressionSet
data(DivergenceExpressionSetExample)
# plot evolutionary old PS (PS1-3) vs evolutionary young PS (PS4-12)
PlotVars(PhyloExpressionSetExample,
Groups = list(c(1:3), c(4:12)),
legendName = "PS",
adjust.range = TRUE)
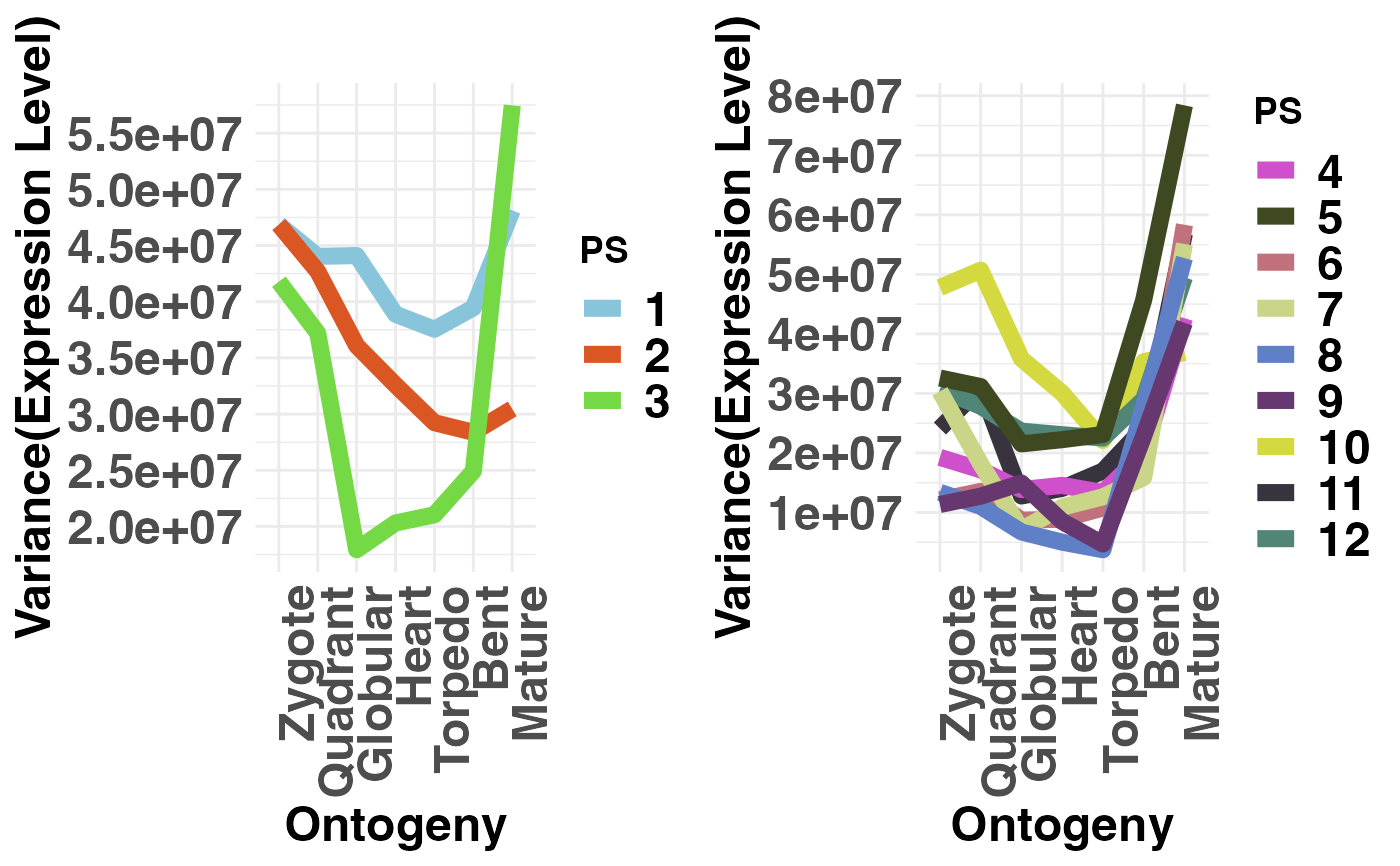
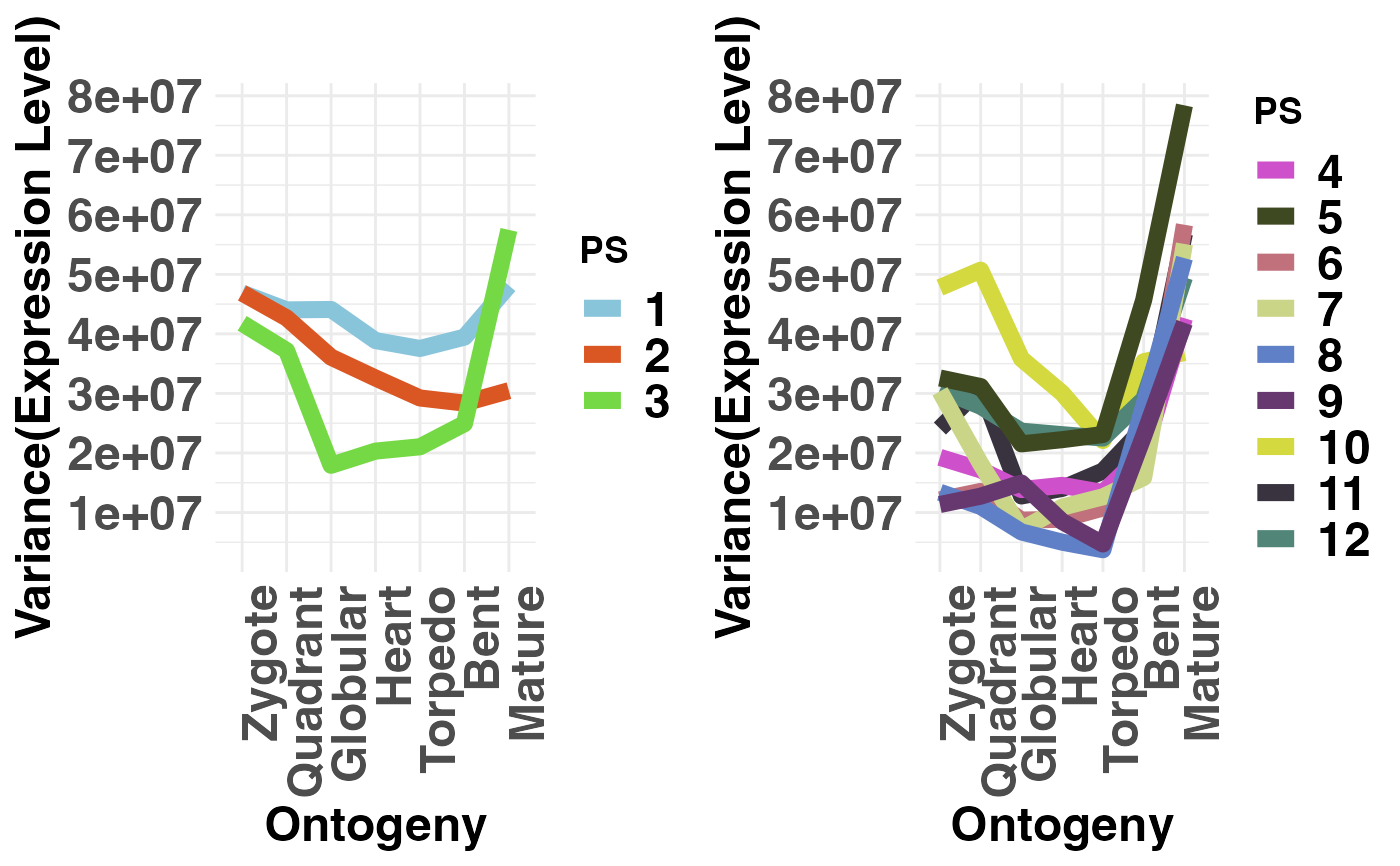 # if users wish to not adjust the y-axis scale when
# 2 groups are selected they can specify: adjust.range = FALSE
PlotVars(PhyloExpressionSetExample,
Groups = list(c(1:3), c(4:12)),
legendName = "PS",
adjust.range = FALSE)
# if users wish to not adjust the y-axis scale when
# 2 groups are selected they can specify: adjust.range = FALSE
PlotVars(PhyloExpressionSetExample,
Groups = list(c(1:3), c(4:12)),
legendName = "PS",
adjust.range = FALSE)
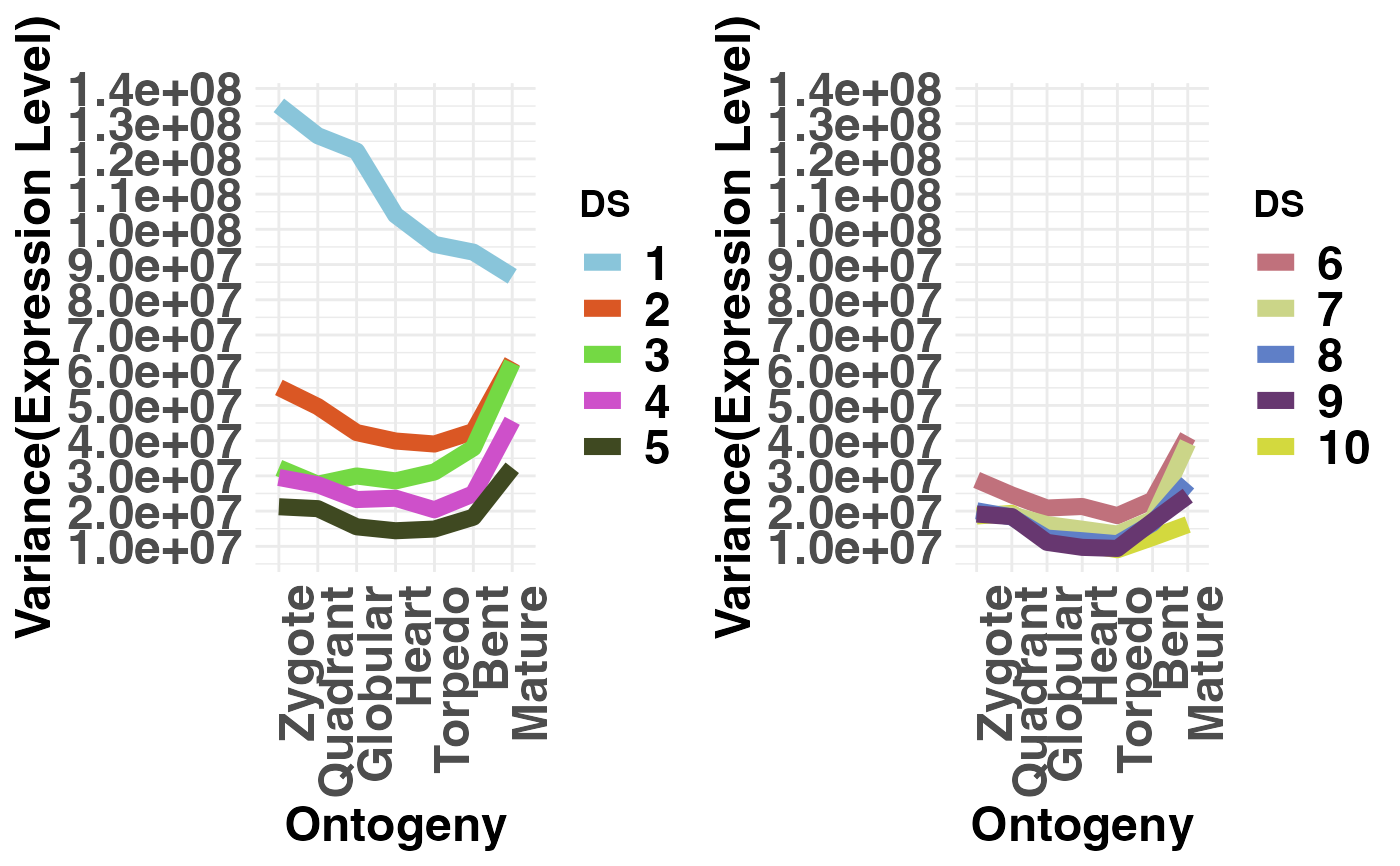
 # plot conserved DS (DS1-5) vs divergent DS (PS6-10)
# NOTE: DS are always defined in the range 1, 2, ... , 10.
# Hence, make sure that your groups are within this range!
PlotVars(DivergenceExpressionSetExample,
Groups = list(c(1:5), c(6:10)),
legendName = "DS",
adjust.range = TRUE)
# plot conserved DS (DS1-5) vs divergent DS (PS6-10)
# NOTE: DS are always defined in the range 1, 2, ... , 10.
# Hence, make sure that your groups are within this range!
PlotVars(DivergenceExpressionSetExample,
Groups = list(c(1:5), c(6:10)),
legendName = "DS",
adjust.range = TRUE)