This function takes a PhyloExpressionSet or DivergenceExpressionSet object as input and computes
for two or more defined phylostratum (divergence stratum) classes the statistical significance of
the differences of mean relative expression of these two (or more) corresponding phylostratum (divergence stratum) classes.
As test-statistic, the function performs a nonparametric kruskal.test
based on relative expression values stored within each defined phylostratum class.
Usage
PlotBarRE(
  ExpressionSet,
  Groups = NULL,
  wLength = 0.1,
  ratio = FALSE,
  p.adjust.method = NULL,
  ...
)
Arguments
- ExpressionSet
a standard PhyloExpressionSet or DivergenceExpressionSet object.
- Groups
a list containing the phylostrata or divergence-strata that correspond to the same phylostratum class or divergence class. For ex. evolutionary old phylostrata: PS1-3 (Class 1) and evolutionary young phylostrata: PS4-12 (Class 2). In this case, the
Groupslist could be assigned as,Groups= list(c(1:3), c(4:12)). It is also possible to define more than 2 groups of evolutionary ages. For ex.Groups= list(c(1:3),c(4:8),c(9:12)) would perform akruskal.testto determine the statistical significance of the evolutionary classes PS1-3, PS4-6, and PS9-12 based on their corresponding mean relative expression levels.- wLength
a numeric value defining the whiskers length above the bars. In case there are numerous different phylostratum classes a smaller
wLengthparameter should be used for better visualizations.- ratio
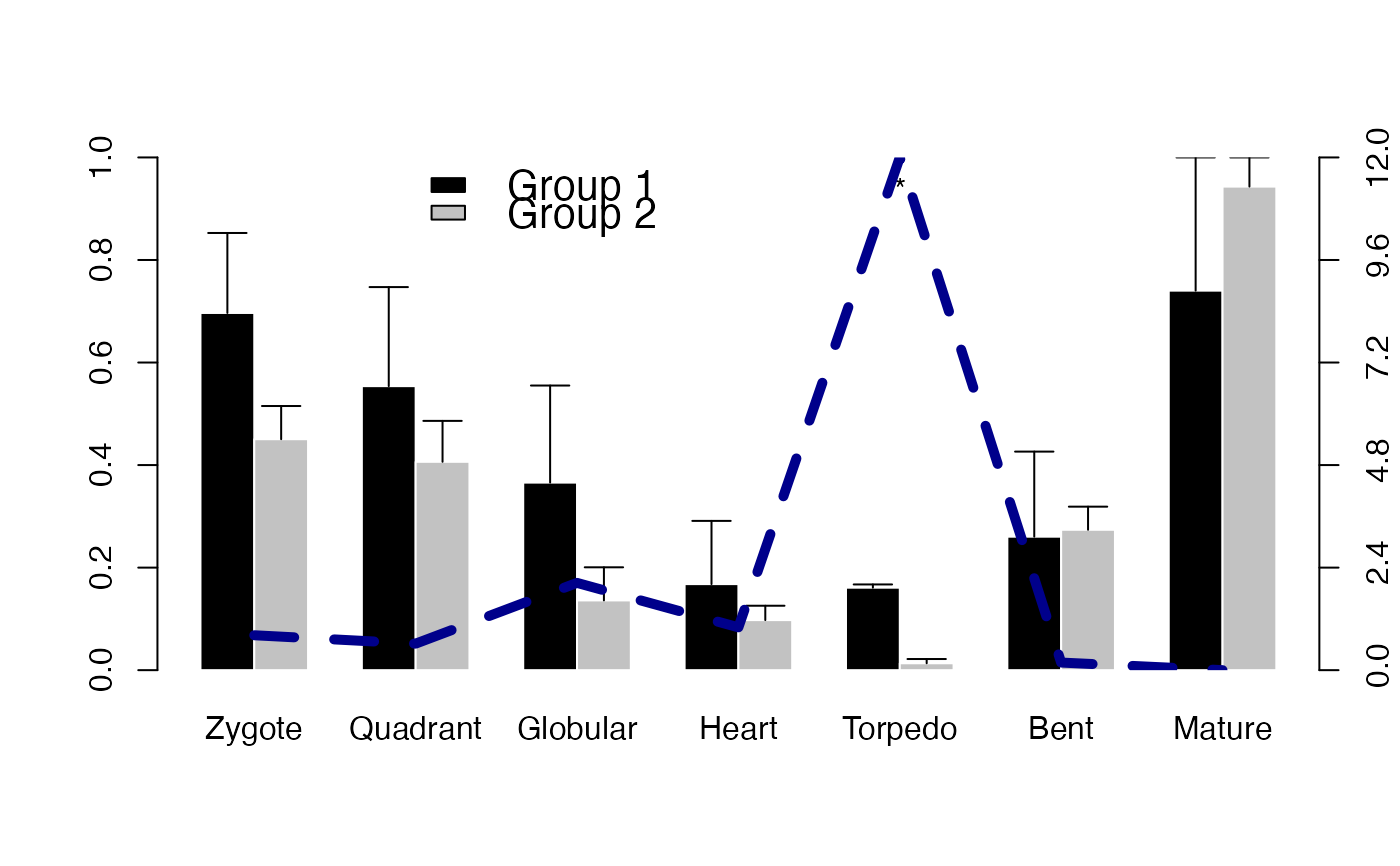
a boolean value specifying whether the bars in the barplot represent the mean relative expression level of phylostrata belonging to the same phylostratum class. In case
ratio= TRUE, the ratio of the mean relative expression level of the two phylostrata classes is plotted as lines within the barplot. This parameter can only be used for 2 class comparisons.- p.adjust.method
correction method to adjust p-values for multiple comparisons (see
p.adjustfor possible methods). E.g.,p.adjust.method = "BH"(Benjamini & Hochberg (1995)) orp.adjust.method = "bonferroni"(Bonferroni correction).- ...
default graphics parameters.
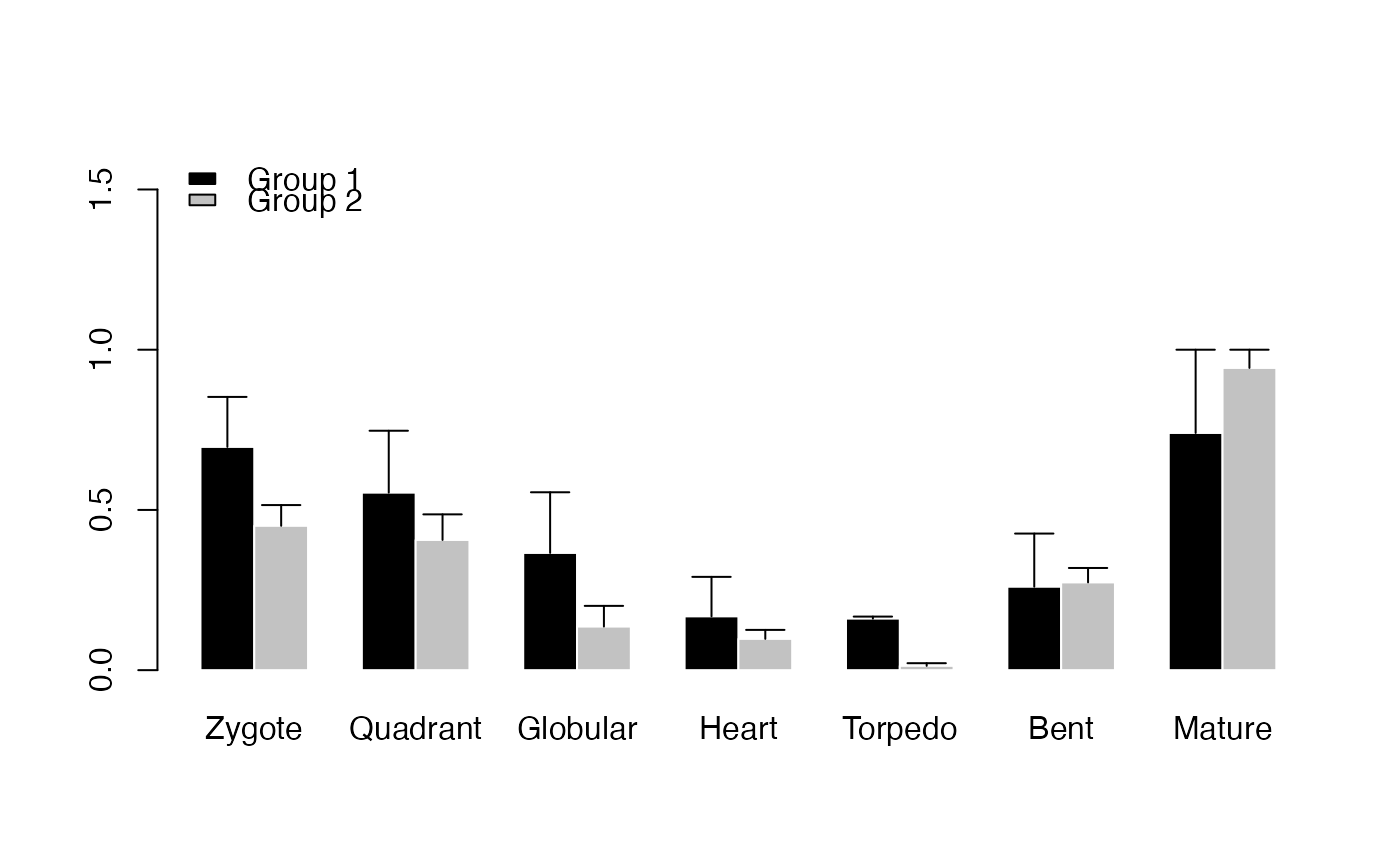
Value
A barplot comparing Phylostratum-Classes by its mean relative expression levels. Significant stages are marked by '*' referring to statistically significant differences:
(1) '*' = P-Value <= 0.05
(2) '**' = P-Value <= 0.005
(3) '***' = P-Value <= 0.0005
Details
In case a large number of developmental stages is included in the input ExpressionSet,
p-values returned by PlotBarRE should be adjusted for multiple comparisons which can be done
by specifying the p.adjust.method argument.
References
Quint M et al. 2012. "A transcriptomic hourglass in plant embryogenesis". Nature (490): 98-101.
Domazet-Loso T. and Tautz D. 2010. "A phylogenetically based transcriptome age index mirrors ontogenetic divergence patterns". Nature (468): 815-818.
Myles Hollander and Douglas A. Wolfe (1973), Nonparametric Statistical Methods. New York: John Wiley & Sons. Pages 115-120.
Examples
# read standard phylotranscriptomics data
data(PhyloExpressionSetExample)
data(DivergenceExpressionSetExample)
# example PhyloExpressionSet
PlotBarRE(ExpressionSet = PhyloExpressionSetExample,
Groups = list(c(1:3), c(4:12)))
 # example DivergenceExpressionSet
PlotBarRE(ExpressionSet = DivergenceExpressionSetExample,
Groups = list(c(1:5), c(6:10)))
# example DivergenceExpressionSet
PlotBarRE(ExpressionSet = DivergenceExpressionSetExample,
Groups = list(c(1:5), c(6:10)))
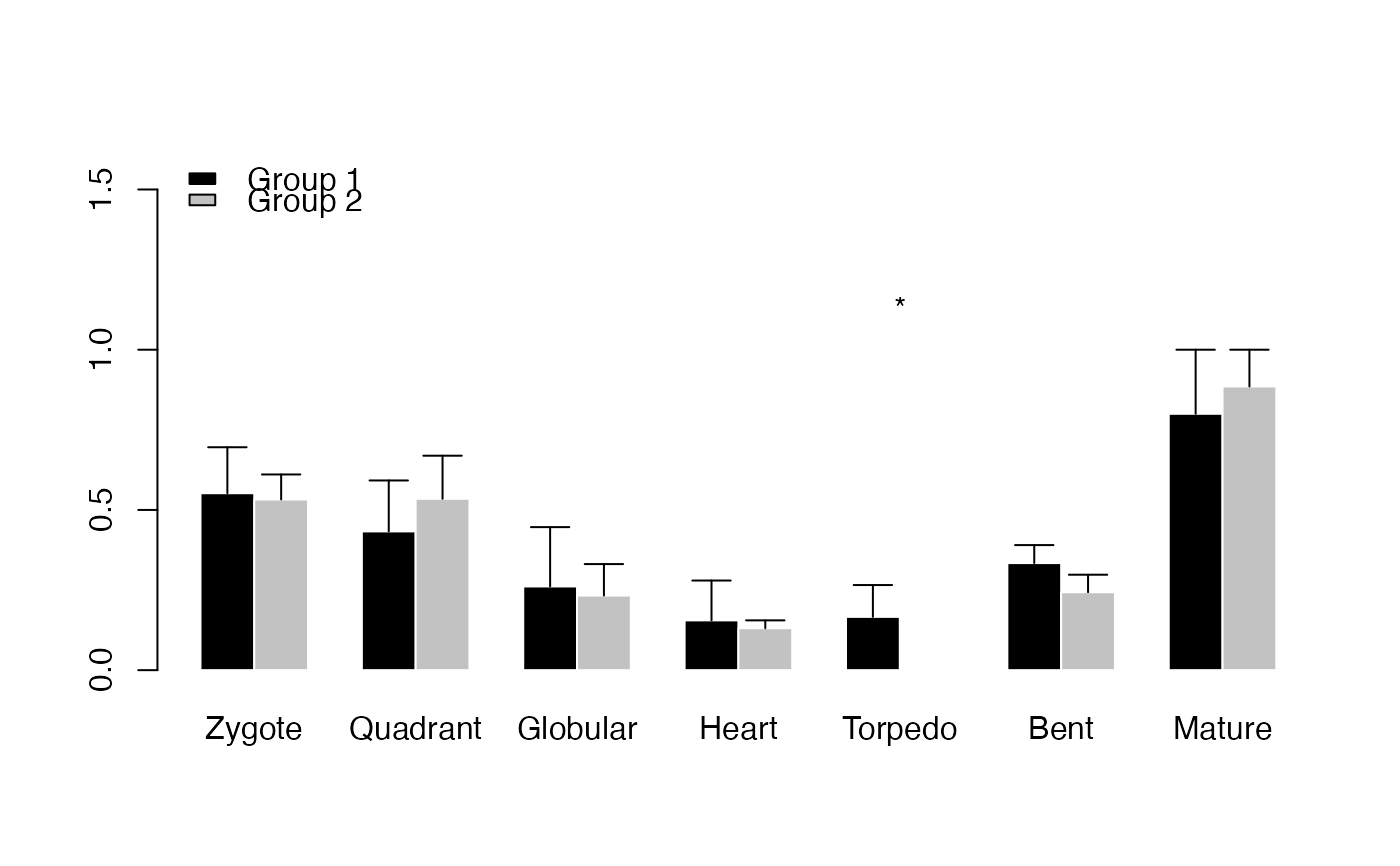 # Perform PlotBarRE() with p-value adjustment method Benjamini & Hochberg (1995)
PlotBarRE(ExpressionSet = PhyloExpressionSetExample,
Groups = list(c(1:3), c(4:12)),
p.adjust.method = "BH")
# Perform PlotBarRE() with p-value adjustment method Benjamini & Hochberg (1995)
PlotBarRE(ExpressionSet = PhyloExpressionSetExample,
Groups = list(c(1:3), c(4:12)),
p.adjust.method = "BH")
 # Example: plot ratio
# the ratio curve visualizes the ratio between bar 1 / bar 2
# the z - axis shows the corresponding ratio value of bar 1 / bar 2
PlotBarRE(ExpressionSet = PhyloExpressionSetExample,
Groups = list(c(1:3), c(4:12)),
ratio = TRUE)
# Example: plot ratio
# the ratio curve visualizes the ratio between bar 1 / bar 2
# the z - axis shows the corresponding ratio value of bar 1 / bar 2
PlotBarRE(ExpressionSet = PhyloExpressionSetExample,
Groups = list(c(1:3), c(4:12)),
ratio = TRUE)