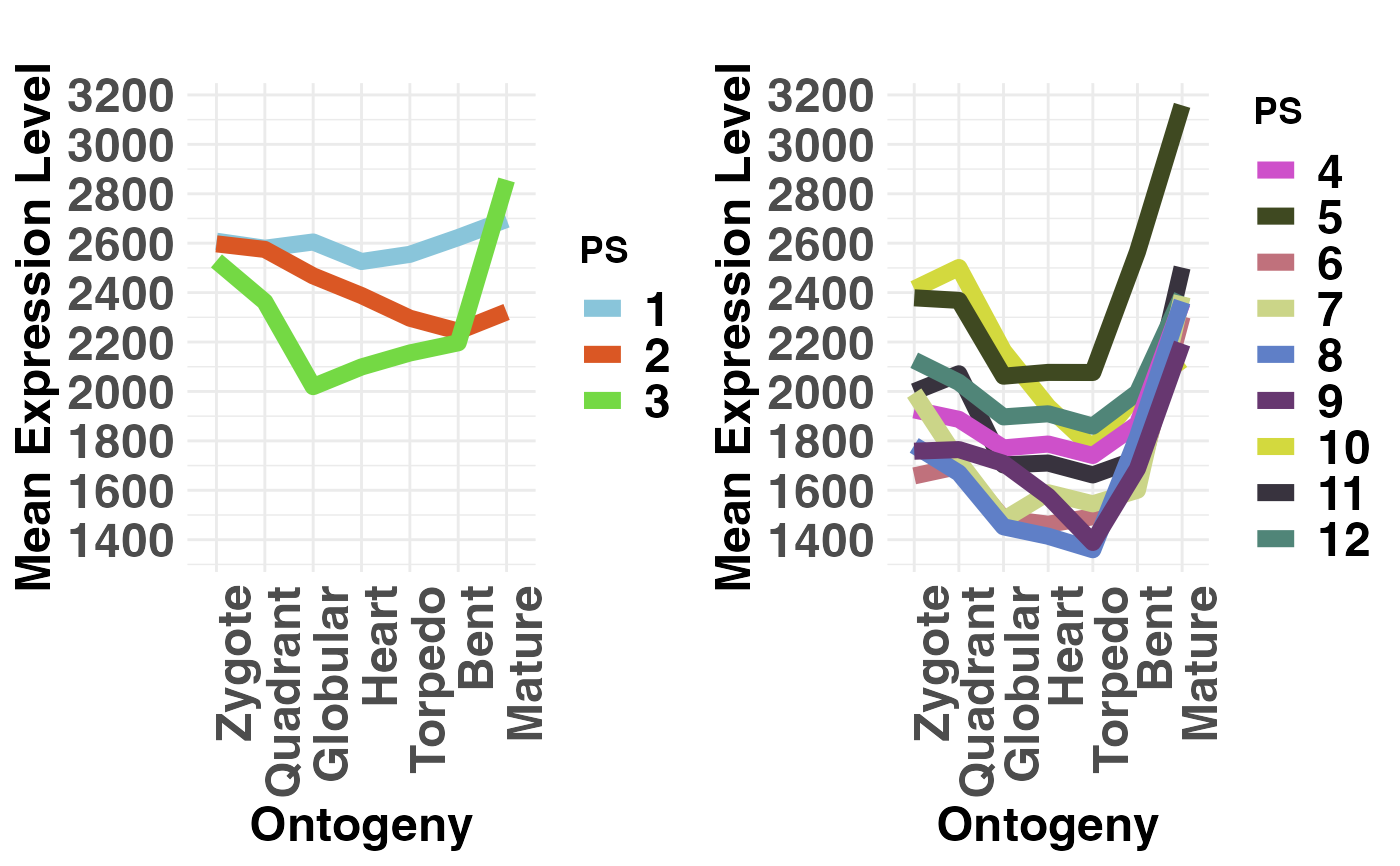
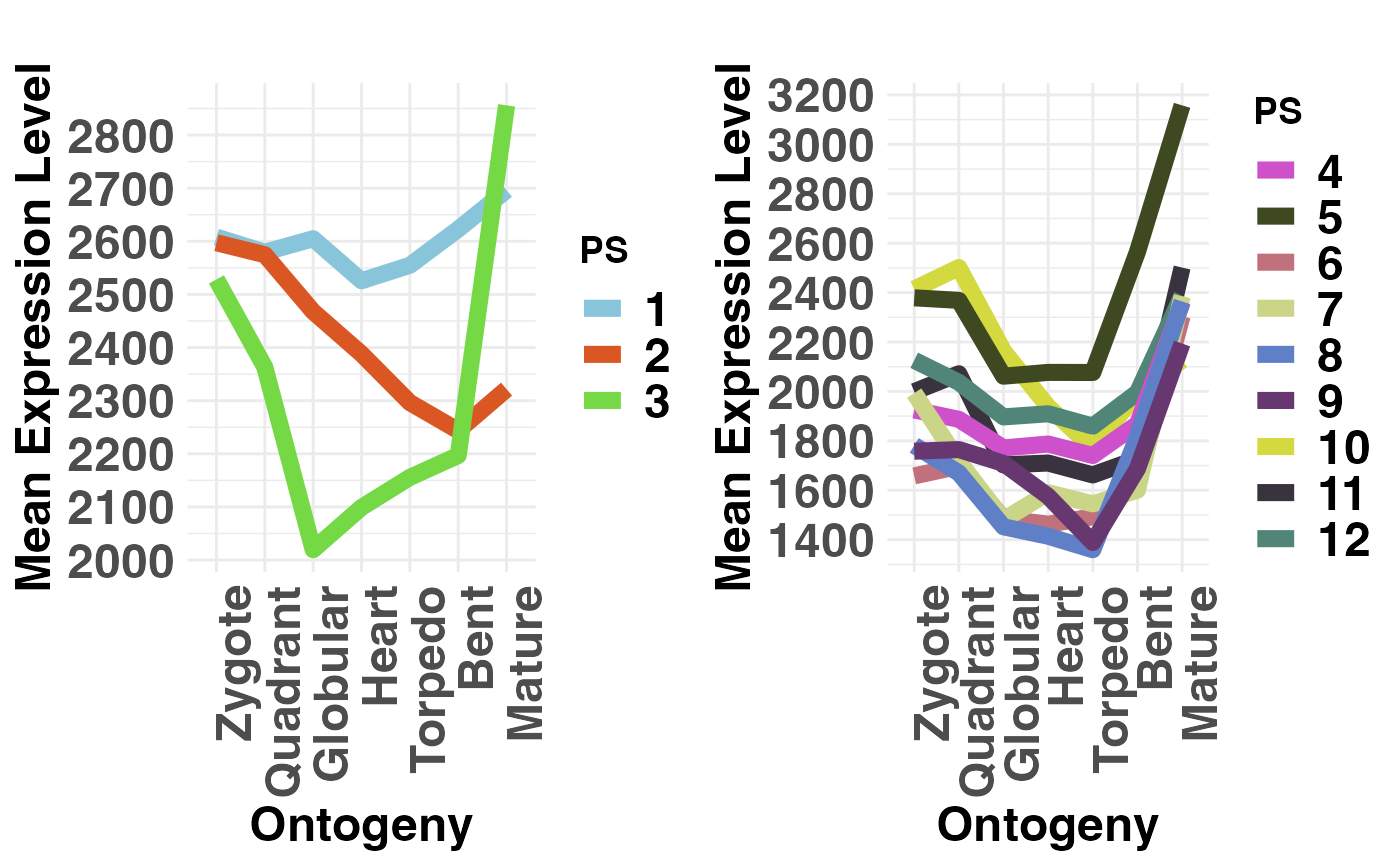
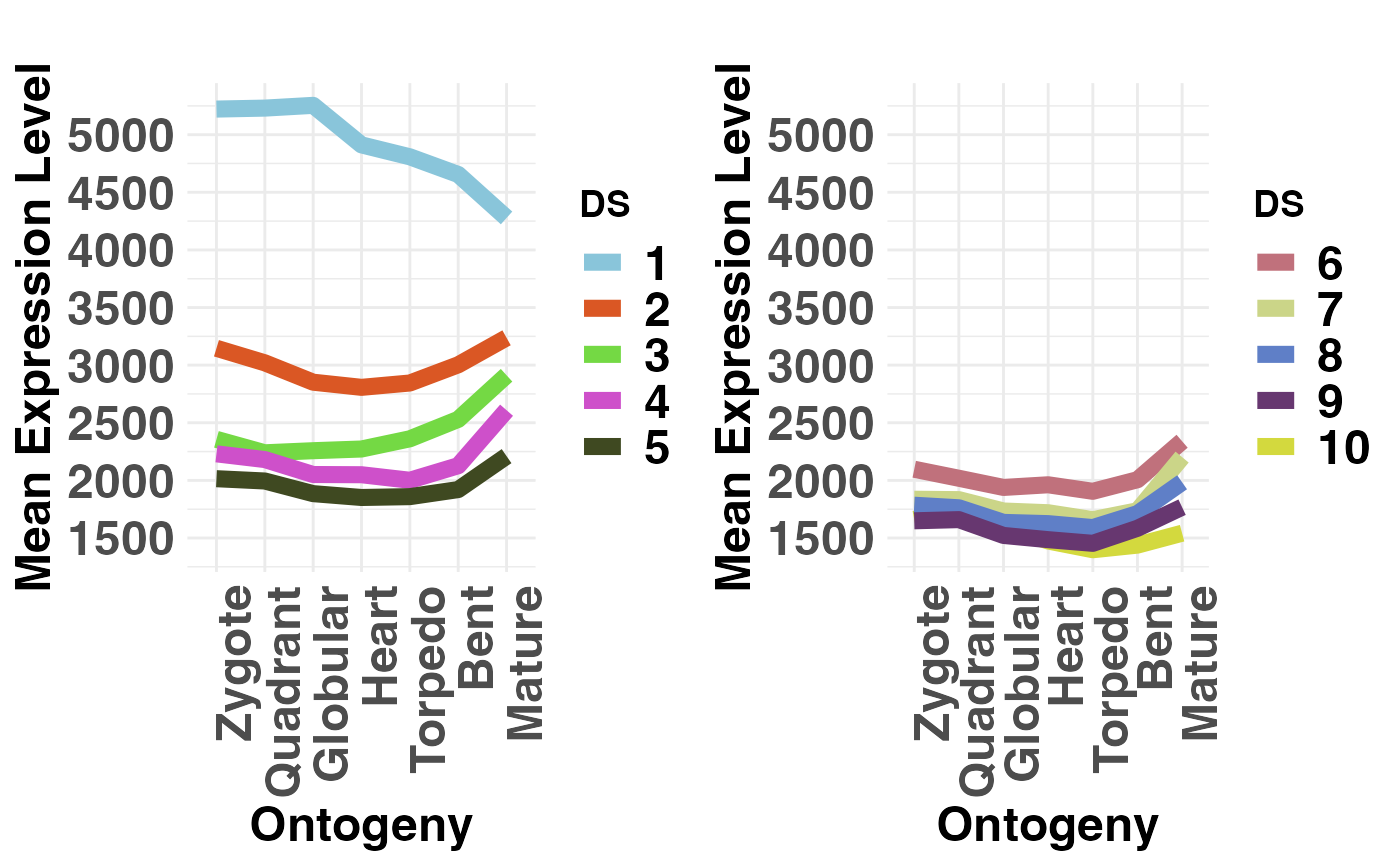
This function computes for each age category the corresponding mean expression profile.
Usage
PlotMeans(
  ExpressionSet,
  Groups = NULL,
  modules = NULL,
  legendName = "age",
  xlab = "Ontogeny",
  ylab = "Mean Expression Level",
  main = "",
  y.ticks = 10,
  adjust.range = TRUE,
  alpha = 0.008,
  ...
)
Arguments
- ExpressionSet
a standard PhyloExpressionSet or DivergenceExpressionSet object.
- Groups
a list containing the age categories for which mean expression levels shall be drawn. For ex. evolutionary users can compare old phylostrata: PS1-3 (Class 1) and evolutionary young phylostrata: PS4-12 (Class 2). In this example, the list could be assigned as,
Groups = list(c(1:3), c(4:12)). The group options is limited to 2 Groups.- modules
a list storing three elements for specifying the modules: early, mid, and late. Each element expects a numeric vector specifying the developmental stages or experiments that correspond to each module. For example,
module=list(early = 1:2, mid = 3:5, late = 6:7)devides a dataset storing seven developmental stages into 3 modules. Default ismodules = NULL. But if specified, a shaded are will be drawn to illustrate stages corresponding to the mid module.- legendName
a character string specifying the legend title.
- xlab
label of x-axis.
- ylab
label of y-axis.
- main
main text.
- y.ticks
number of ticks that shall be drawn on the y-axis.
- adjust.range
logical indicating whether or not the y-axis scale shall be adjusted to the same range in case two groups are specified. Default is
adjust.range = TRUE.- alpha
transparency of the shaded area (between [0,1]). Default is
alpha = 0.1.- ...
place holder for old version of PlotMeans that was based on base graphics instead of ggplot2.
Details
This plot may be useful to compare the absolute mean expression levels of each age category across stages.
In different developmental processes different phylostratum or divergence-stratum
classes might be more expressed than others, hence contributing more to the overall
phylotranscriptomics pattern (TAI or TDI).
This plot can help to identify the phylostratum or divergence-stratum classes
that contributes most to the overall transcriptome of the given developmental process.
Examples
### Example using a PhyloExpressionSet
### and DivergenceExpressionSet
# load PhyloExpressionSet
data(PhyloExpressionSetExample)

# load PhyloExpressionSet
data(DivergenceExpressionSetExample)

# plot evolutionary old PS (PS1-3) vs evolutionary young PS (PS4-12)
PlotMeans(PhyloExpressionSetExample,
          Groups = list(c(1:3), c(4:12)),
          legendName = "PS",
          adjust.range = TRUE)


# if users wish to not adjust the y-axis scale when
# 2 groups are selected they can specify: adjust.range = FALSE
PlotMeans(PhyloExpressionSetExample,
          Groups = list(c(1:3), c(4:12)),
          legendName = "PS",
          adjust.range = FALSE)


# plot conserved DS (DS1-5) vs divergent DS (PS6-10)
# NOTE: DS are always defined in the range 1, 2, ... , 10.
# Hence, make sure that your groups are within this range!
PlotMeans(DivergenceExpressionSetExample,
          Groups = list(c(1:5), c(6:10)),
          legendName = "DS",
          adjust.range = TRUE)

