This function computes the cumulative contribution of each Phylostratum or Divergence Stratum to the global TAI or TDI profile.
Usage
PlotContribution(
  ExpressionSet,
  legendName = NULL,
  xlab = "Ontogeny",
  ylab = "Transcriptome Index",
  main = "",
  y.ticks = 10
)
Arguments
- ExpressionSet
a standard PhyloExpressionSet or DivergenceExpressionSet object.
- legendName
a character string specifying whether "PS" or "DS" are used to compute relative expression profiles.
- xlab
label of x-axis.
- ylab
label of y-axis.
- main
main title.
- y.ticks
a numeric value specifying the number of ticks to be drawn on the y-axis.
Details
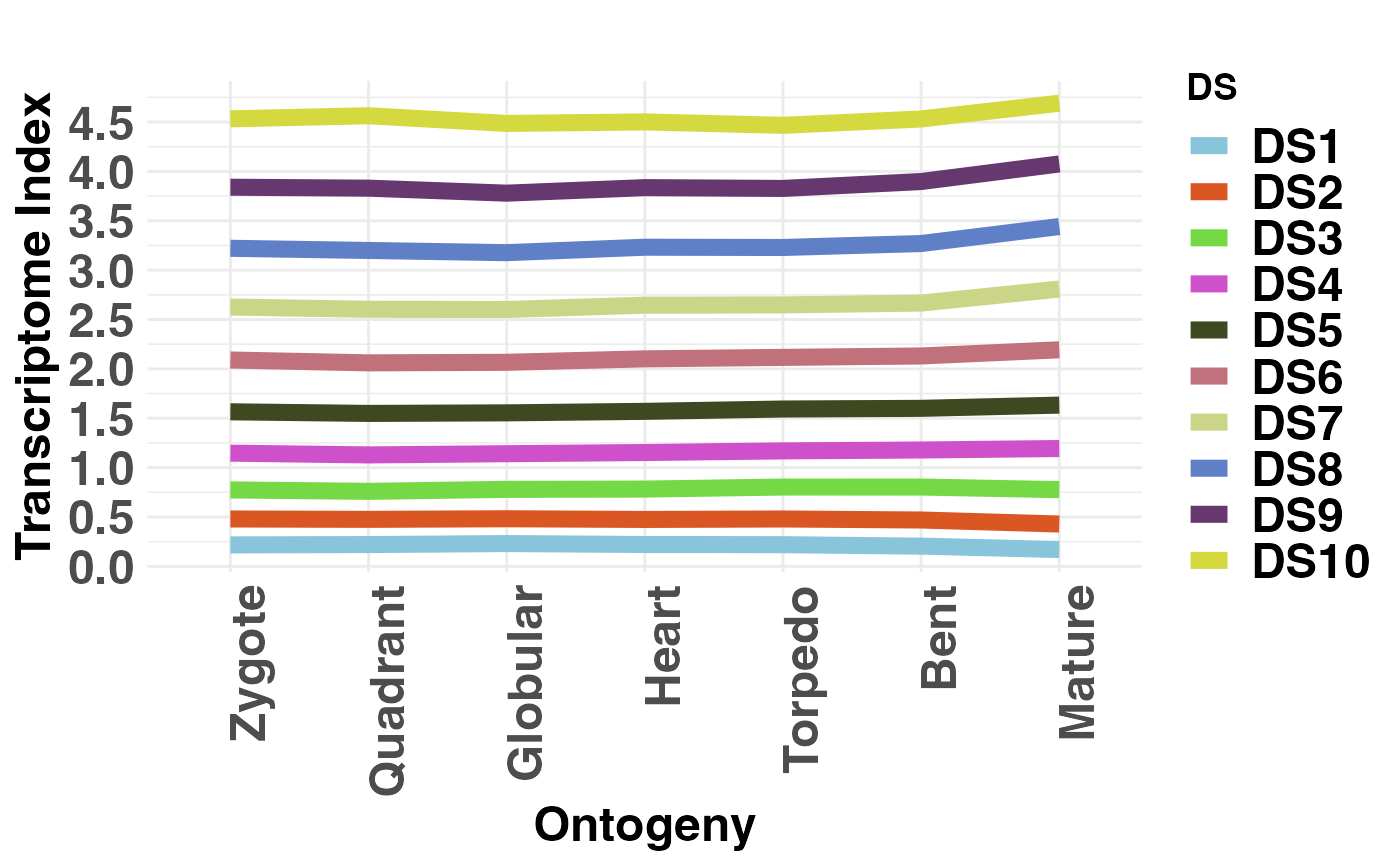
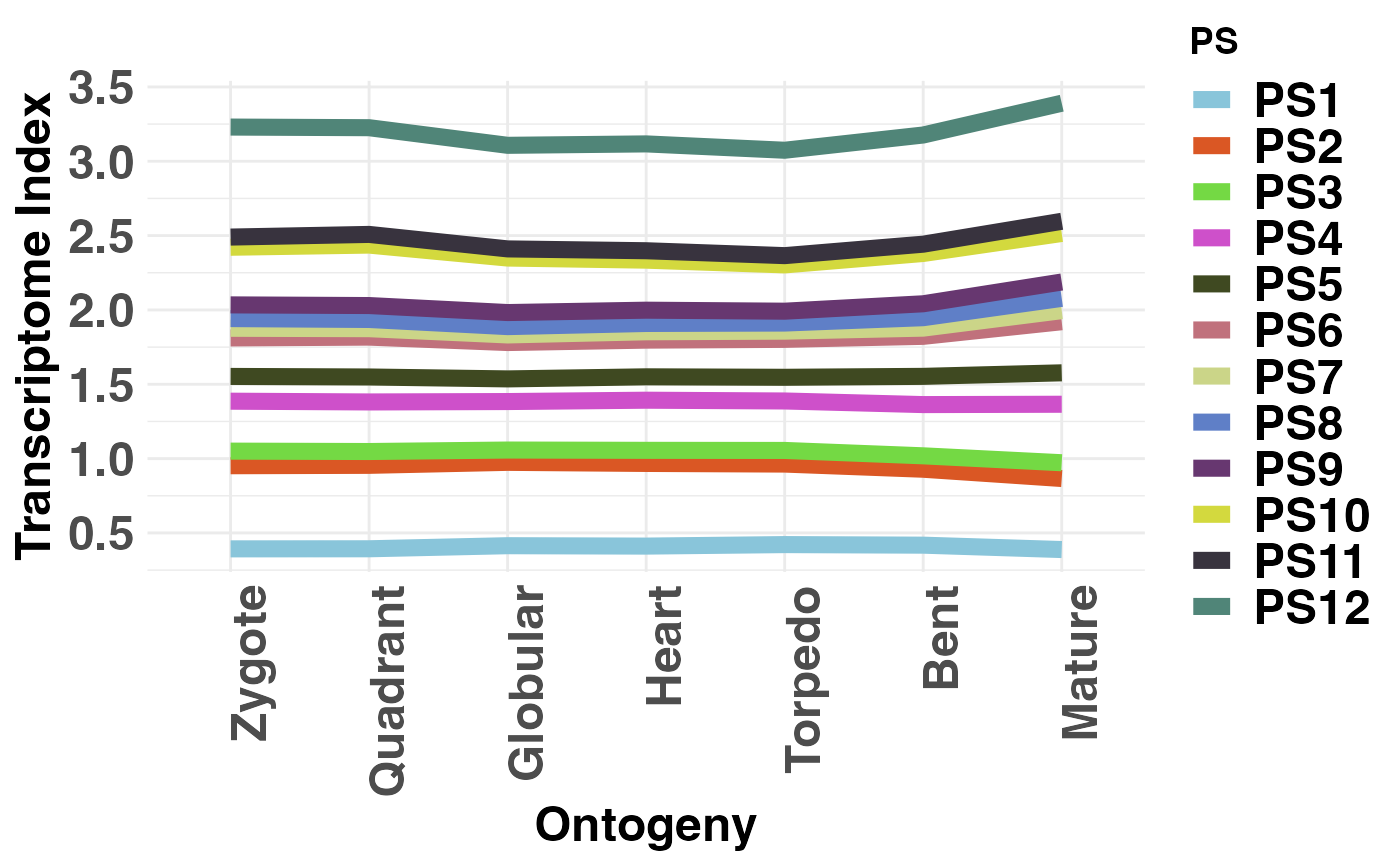
Introduced by Domazet-Loso and Tautz (2010), this function allows users to visualize the cumulative contribution of each Phylostratum or Divergence Stratum to the global Transcriptome Age Index or Transcriptome Divergence Index profile to quantify how each Phylostratum or Divergence Stratum influences the profile of the global TAI or TDI pattern.
References
Domazet-Loso T. and Tautz D. (2010). A phylogenetically based transcriptome age index mirrors ontogenetic divergence patterns. Nature (468): 815-818.
See also
pTAI, pTDI, TAI, TDI, PlotSignature
Examples
 data(PhyloExpressionSetExample)
 data(DivergenceExpressionSetExample)

 # visualize phylostratum contribution to global TAI
 PlotContribution(PhyloExpressionSetExample, legendName = "PS")


 # visualize divergence stratum contribution to global TDI
 PlotContribution(DivergenceExpressionSetExample, legendName = "DS")
# visualize divergence stratum contribution to global TDI
PlotContribution(DivergenceExpressionSetExample, legendName = "DS")