Main function to visualize transcriptome indices.
Usage
PlotSignature(
  ExpressionSet,
  measure = "TAI",
  TestStatistic = "FlatLineTest",
  modules = NULL,
  permutations = 1000,
  lillie.test = FALSE,
  p.value = TRUE,
  shaded.area = FALSE,
  custom.perm.matrix = NULL,
  xlab = "Ontogeny",
  ylab = "Transcriptome Index",
  main = "",
  lwd = 4,
  alpha = 0.1,
  y.ticks = 10
)
Arguments
- ExpressionSet
a standard PhyloExpressionSet, DivergenceExpressionSet or PolymorphismsExpressionSet object.
- measure
type of transcriptome index that shall be computed. E.g.
measure = "TAI"(Transcriptome Age Index)measure = "TDI"(Transcriptome Divergence Index)measure = "TPI"(Transcriptome Polymorphism Index)
- TestStatistic
a string defining the type of test statistics to be used to quantify the statistical significance the present phylotranscriptomics pattern. Possible values can be:
TestStatistic="FlatLineTest": Statistical test for the deviation from a flat lineTestStatistic="ReductiveHourglassTest": Statistical test for the existence of a hourglass shape (high-low-high pattern)TestStatistic="EarlyConservationTest": Statistical test for the existence of a early conservation pattern (low-high-high pattern)TestStatistic="LateConservationTest": Statistical test for the existence of a late conservation pattern (high-high-low pattern)TestStatistic="ReverseHourglassTest": Statistical test for the existence of a reverse hourglass pattern (low-high-low pattern)
- modules
a list storing three elements for the
ReductiveHourglassTest,EarlyConservationTest,LateConservationTest, orReverseHourglassTest: early, mid, and late. Each element expects a numeric vector specifying the developmental stages or experiments that correspond to each module. For example:module=list(early = 1:2, mid = 3:5, late = 6:7)divides a dataset storing seven developmental stages into 3 modules.
- permutations
a numeric value specifying the number of permutations to be performed for the
FlatLineTest,EarlyConservationTest,LateConservationTest,ReductiveHourglassTestorReverseHourglassTest.- lillie.test
a boolean value specifying whether the Lilliefors Kolmogorov-Smirnov Test shall be performed.
- p.value
a boolean value specifying whether the p-value of the test statistic shall be printed as a subtitle.
- shaded.area
a boolean value specifying whether a shaded area shall be drawn for the developmental stages defined to be the presumptive phylotypic period.
- custom.perm.matrix
a custom
bootMatrix(permutation matrix) to perform the underlying test statistic visualized byPlotSignature. Default iscustom.perm.matrix = NULL.- xlab
label of x-axis.
- ylab
label of y-axis.
- main
figure title.
- lwd
line width.
- alpha
transparency of the shaded area (between [0,1]). Default is
alpha = 0.1.- y.ticks
number of ticks on the y-axis. Default is
ticks = 10.
Details
This function substitutes the functionality of the PlotPattern function
and is based on ggplot2 insead of base R graphics.
The following transcriptome indices can be computed and visualized with this function:
Examples
data(PhyloExpressionSetExample)
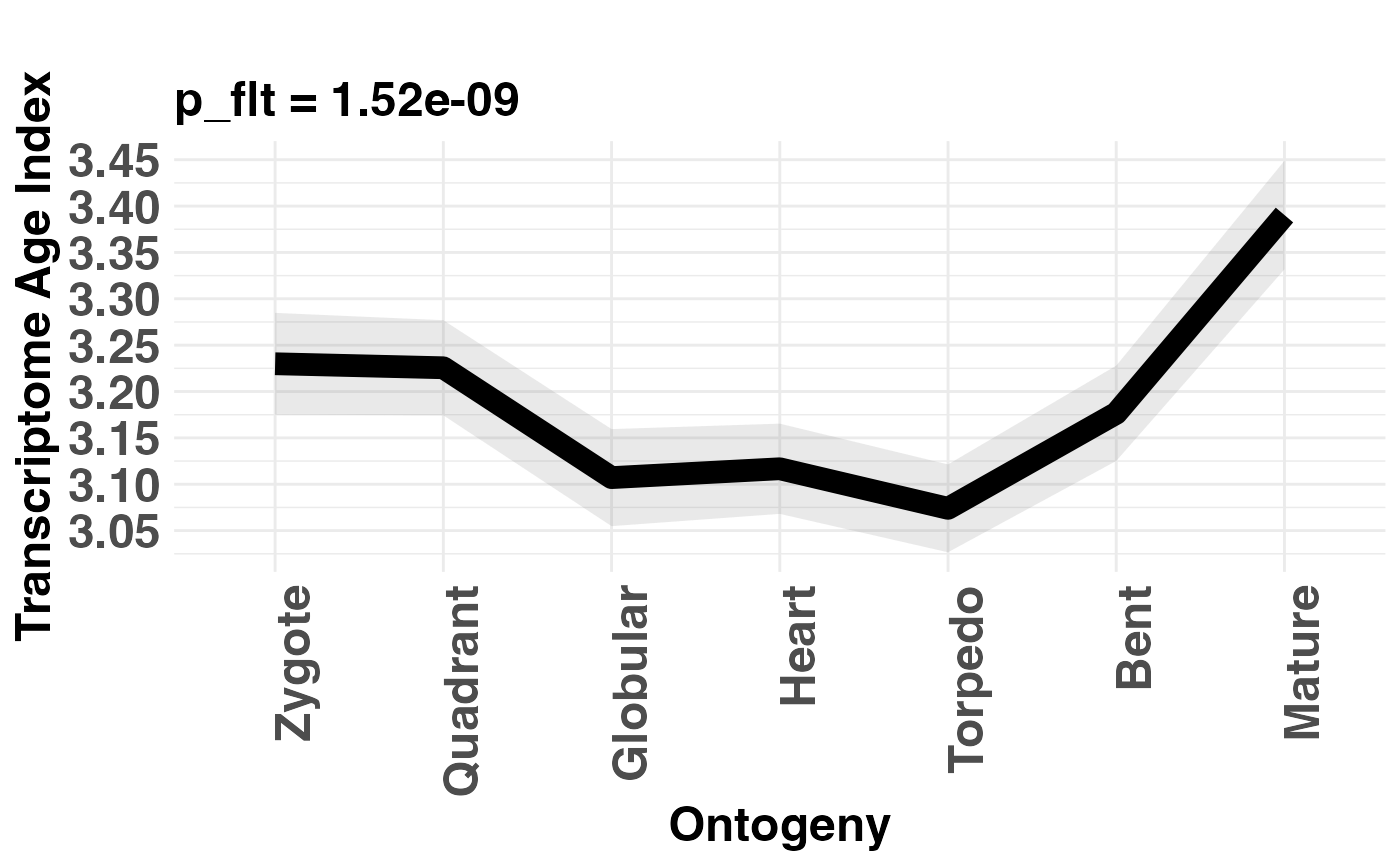
# plot TAI pattern and perform flat line test
PlotSignature(PhyloExpressionSetExample,
measure = "TAI",
permutations = 100,
TestStatistic = "FlatLineTest",
ylab = "Transcriptome Age Index")
#> Plot signature: ' TAI ' and test statistic: ' FlatLineTest ' running 100 permutations.
#>
#> [ Number of Eigen threads that are employed on your machine: 12 ]
#>
#> [ Computing age assignment permutations for test statistic ... ]
#>
[=========================================] 100%
#> [ Computing variances of permuted transcriptome signatures ... ]
#>
#>
#> [ Number of Eigen threads that are employed on your machine: 12 ]
#>
#> [ Computing age assignment permutations for test statistic ... ]
#>
[=========================================] 100%
#> [ Computing variances of permuted transcriptome signatures ... ]
#>
#>
#> Total runtime of your permutation test: 0.015 seconds.
#>
#> -> We recommended using at least 20000 permutations to achieve a sufficient permutation test.
#>
#> Significance status of signature: significant.
#>
#> -> Now run 'FlatLineTest(..., permutations = 100, plotHistogram = TRUE)' to analyse the permutation test performance.