Plot the PS or DS distribution of a selected set of genes
Source:R/PlotSelectedAgeDistr.R
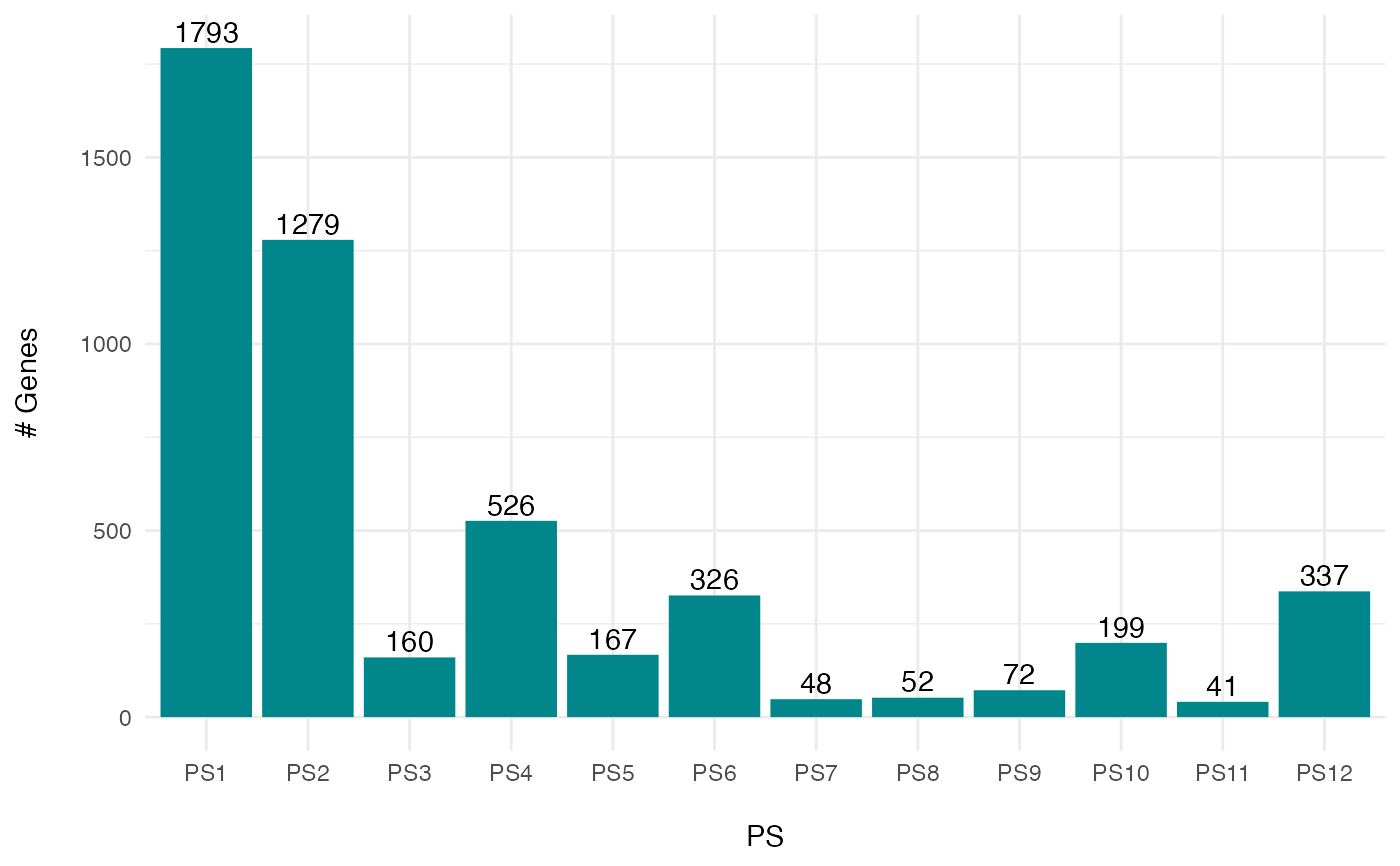
PlotSelectedAgeDistr.RdThis function visualizes the PS or DS distribution of a selected set of genes as histogram.
Usage
PlotSelectedAgeDistr(
  ExpressionSet,
  gene.set,
  legendName = NULL,
  as.ratio = FALSE,
  use.only.map = FALSE,
  col = "turquoise4",
  xlab = NULL,
  ylab = NULL
)
Arguments
- ExpressionSet
a standard PhyloExpressionSet or DivergenceExpressionSet object.
- gene.set
a character vector storing the gene ids for which gene expression profiles shall be visualized.
- legendName
a character string specifying whether "PS" or "DS" are are visualized.
- as.ratio
logical value indicating whether or not relative frequencies shall be visualized.
- use.only.map
logical value indicating whether or not a Phylostratigraphic Map or Divergence Map should be passed to the
ExpressionSetargument instead of a standardExpressionSetobject.- col
colour of the bars.
- xlab
label of the x-axis.
- ylab
label of the y-axis.
Examples
data(PhyloExpressionSetExample)
# generate an example gene set
set.seed(123)
ExGeneSet <- sample(PhyloExpressionSetExample[ , 2], 5000)
# gene count example
PlotSelectedAgeDistr(ExpressionSet = PhyloExpressionSetExample,
gene.set = ExGeneSet,
legendName = "PS",
as.ratio = TRUE)
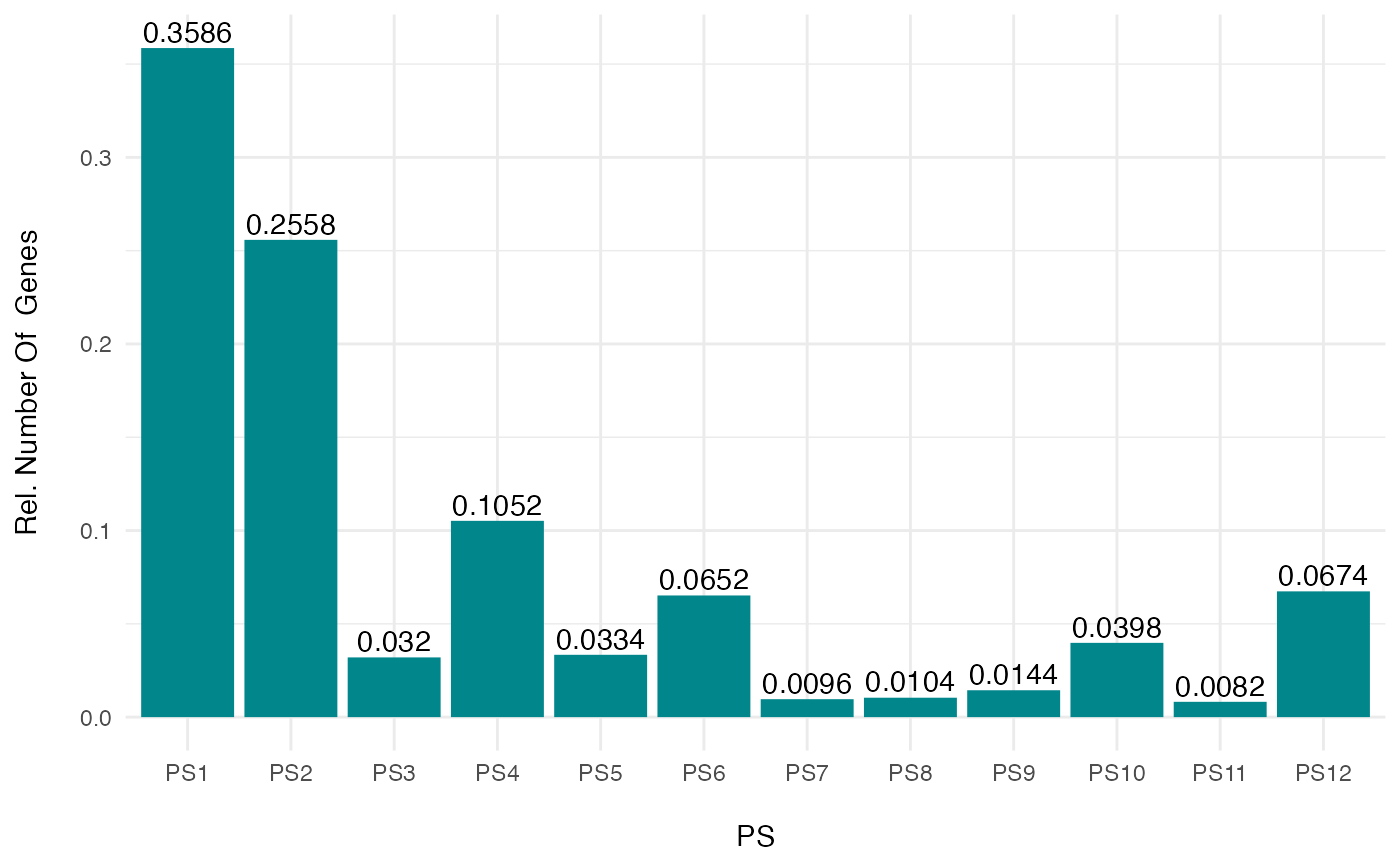 # relative gene count example
PlotSelectedAgeDistr(ExpressionSet = PhyloExpressionSetExample,
gene.set = ExGeneSet,
legendName = "PS",
as.ratio = FALSE)
# relative gene count example
PlotSelectedAgeDistr(ExpressionSet = PhyloExpressionSetExample,
gene.set = ExGeneSet,
legendName = "PS",
as.ratio = FALSE)