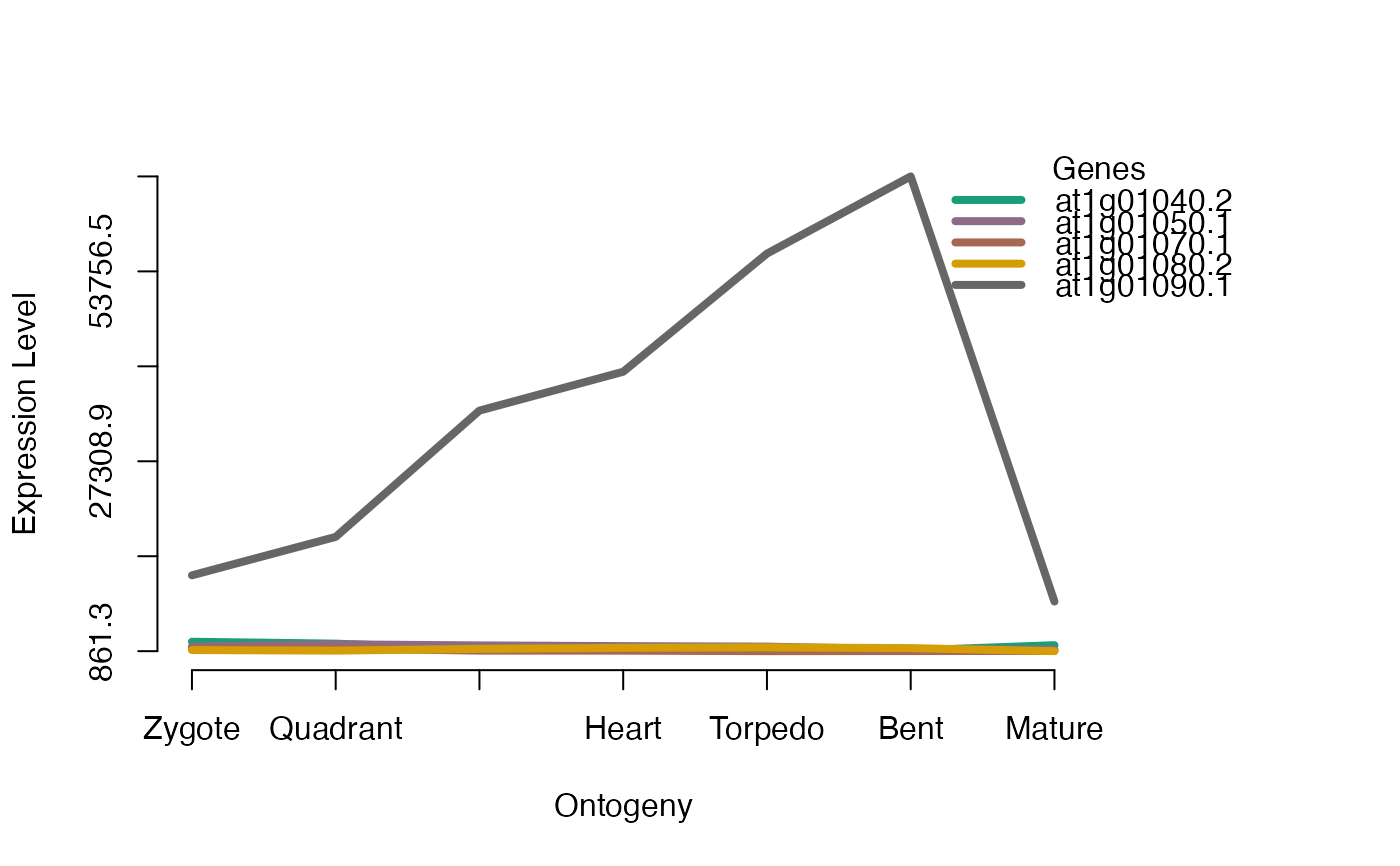
This function simply visualizes the gene expression profiles of
a defined subset of genes stored in the input ExpressionSet.
Usage
PlotGeneSet(
  ExpressionSet,
  gene.set,
  get.subset = FALSE,
  use.only.map = FALSE,
  colors = NULL,
  plot.legend = TRUE,
  y.ticks = 6,
  digits.ylab = 4,
  ...
)
Arguments
- ExpressionSet
a standard PhyloExpressionSet or DivergenceExpressionSet object.
- gene.set
a character vector storing the gene ids for which gene expression profiles shall be visualized.
- get.subset
a logical value indicating whether or not an
ExpressionSetsubset of the selectedgene.setshould be retuned.- use.only.map
a logical value indicating whether instead of a standard
ExpressionSetonly aPhylostratigraphic MaporDivergene Mapis passed to the function.- colors
colors for gene expression profiles. Default:
colors = NULL, hence default colours are used.- plot.legend
a logical value indicating whether gene ids should be printed as legend next to the plot.
- y.ticks
a numeric value specifying the number of ticks to be drawn on the y-axis.
- digits.ylab
a numeric value specifying the number of digits shown for the expression levels on the y-axis.
- ...
additional parameters passed to
matplot.
Details
This function simply visualizes or subsets the gene expression levels of a set of genes
that are stored in the input ExpressionSet.
Examples
data(PhyloExpressionSetExample)

# the best parameter setting to visualize this plot:
# png("test_png.png",700,400)
PlotGeneSet(ExpressionSet = PhyloExpressionSetExample,
            gene.set      = PhyloExpressionSetExample[1:5, 2],
            type          = "l",
            lty           = 1,
            lwd           = 4,
            xlab          = "Ontogeny",
            ylab          = "Expression Level")


# dev.off()

# In case you would like to work with the expression levels
# of selected genes you can specify the 'get.subset' argument:

PlotGeneSet(ExpressionSet = PhyloExpressionSetExample,
            gene.set      = PhyloExpressionSetExample[1:5, 2],
            get.subset    = TRUE)
#>   Phylostratum      GeneID    Zygote   Quadrant  Globular      Heart   Torpedo
#> 1            1 at1g01040.2  2173.635  1911.2001  1152.555  1291.4224  1000.253
#> 2            1 at1g01050.1  1501.014  1817.3086  1665.309  1564.7612  1496.321
#> 3            1 at1g01070.1  1212.793  1233.0023   939.200   929.6195   864.218
#> 4            1 at1g01080.2  1016.920   936.3837  1181.338  1329.4734  1392.643
#> 5            1 at1g01090.1 11424.567 16778.1685 34366.649 39775.6405 56231.569
#>         Bent    Mature
#> 1   962.9772 1696.4274
#> 2  1114.6435 1071.6555
#> 3   877.2060  894.8189
#> 4  1287.9746  861.2605
#> 5 66980.3673 7772.5617


# get a gene subset using only a phylostratihraphic map
ExamplePSMap <- PhyloExpressionSetExample[ , 1:2]

PlotGeneSet(ExpressionSet = ExamplePSMap,
            gene.set      = PhyloExpressionSetExample[1:5, 2],
            get.subset    = TRUE,
            use.only.map  = TRUE)
#>   Phylostratum      GeneID
#> 1            1 at1g01040.2
#> 2            1 at1g01050.1
#> 3            1 at1g01070.1
#> 4            1 at1g01080.2
#> 5            1 at1g01090.1
# dev.off()
# In case you would like to work with the expression levels
# of selected genes you can specify the 'get.subset' argument:
PlotGeneSet(ExpressionSet = PhyloExpressionSetExample,
gene.set = PhyloExpressionSetExample[1:5, 2],
get.subset = TRUE)
#> Phylostratum GeneID Zygote Quadrant Globular Heart Torpedo
#> 1 1 at1g01040.2 2173.635 1911.2001 1152.555 1291.4224 1000.253
#> 2 1 at1g01050.1 1501.014 1817.3086 1665.309 1564.7612 1496.321
#> 3 1 at1g01070.1 1212.793 1233.0023 939.200 929.6195 864.218
#> 4 1 at1g01080.2 1016.920 936.3837 1181.338 1329.4734 1392.643
#> 5 1 at1g01090.1 11424.567 16778.1685 34366.649 39775.6405 56231.569
#> Bent Mature
#> 1 962.9772 1696.4274
#> 2 1114.6435 1071.6555
#> 3 877.2060 894.8189
#> 4 1287.9746 861.2605
#> 5 66980.3673 7772.5617
# get a gene subset using only a phylostratihraphic map
ExamplePSMap <- PhyloExpressionSetExample[ , 1:2]
PlotGeneSet(ExpressionSet = ExamplePSMap,
gene.set = PhyloExpressionSetExample[1:5, 2],
get.subset = TRUE,
use.only.map = TRUE)
#> Phylostratum GeneID
#> 1 1 at1g01040.2
#> 2 1 at1g01050.1
#> 3 1 at1g01070.1
#> 4 1 at1g01080.2
#> 5 1 at1g01090.1